How Do Candlestick Patterns Work? A Complete Guide to Understanding Market Movements
In financial markets, traders and investors use a variety of tools to analyze price movements and make informed decisions. One of the most popular and visually intuitive tools is the candlestick chart and at the heart of these charts are candlestick patterns. But how do candlestick patterns work, and why are they so essential in trading?
In this guide, we break down the mechanics, psychology, structure, and application of candlestick patterns so you can begin reading price action like a pro.
What Are Candlestick Patterns?
A candlestick pattern is a visual representation on a price chart that reflects the trading activity of an asset over a defined time period. Each candlestick visually summarizes four important prices:
- Open price
- Close price
- Highest price
- Lowest price
When multiple candlesticks form in sequence, they create patterns that traders use to interpret market sentiment and predict future price movements. Investing legends and technical analysts have long used these patterns as part of their decision-making toolkit.
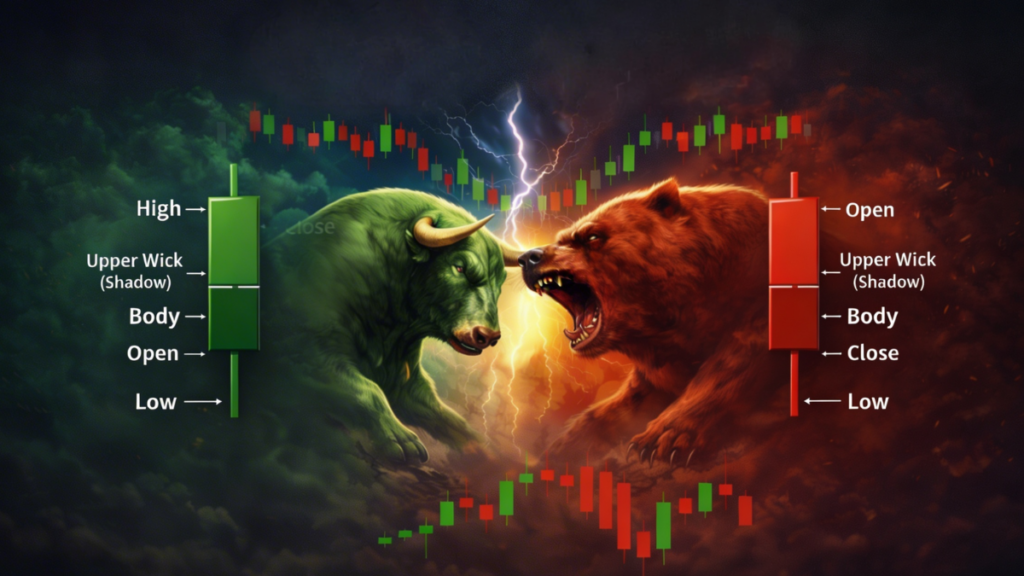
Understanding the Anatomy of a Candlestick
Before learning how patterns work, it’s essential to understand the parts of a candlestick:
- Body: The rectangular section represents the difference between the opening and closing prices.
- Wicks (Shadows): Thin vertical lines that extend above and below the body show the highest and lowest price points during that timeframe.
- Color: A bullish candlestick (usually green or white) means the close was higher than the open, while a bearish candlestick (red or black) means the close was below the open.
This simple structure packs a lot of information. For instance:
- A large body with short wicks suggests strong buyer or seller conviction.
- A small body with long wicks signals hesitation or indecision in the market.
How Candlestick Patterns Reflect Market Psychology?
Every candlestick tells a story — it’s a snapshot of the ongoing “battle” between buyers (bulls) and sellers (bears). Market psychology plays a significant role in how these patterns form and work.
Think of a candlestick as a visual diary entry of trader behavior:
- If buyers dominate, price closes above the open → bullish candle.
- If sellers dominate, price closes below the open → bearish candle.
- When neither side dominates, the result is often a narrow body or indecisive pattern.
Patterns emerge when one or more candles together show a repeated behavior — such as buyers overwhelming sellers after a downtrend, signaling a potential reversal.
In this way, candlestick patterns don’t “predict the future” with certainty, but they represent probabilities based on historical price movement and crowd psychology.
Types of Candlestick Patterns
Candlestick patterns generally fall into three broad categories:
- Bullish Reversal Patterns – Suggest prices may turn upward.
- Bearish Reversal Patterns – Indicate prices could turn downward.
- Continuation Patterns – Suggest the current trend may continue.
Let’s explore some of the most widely referenced patterns across markets.
Bullish Candlestick Patterns
1. Hammer
- A single candle with a small body and long lower wick.
- Appears after a downtrend.
- Signals buyers pushed back sellers, indicating potential strength ahead.
2. Bullish Engulfing
- Two candles where the second (bullish) completely engulfs the first (bearish).
- Suggests buyers have taken control, often after a downtrend.
3. Morning Star
- A three-candle formation: bearish candle → small candle → bullish candle.
- Shows declining selling pressure and rising buy-side pressure.
Bearish Candlestick Patterns
1. Shooting Star
- Small body with a long upper wick at the top of an uptrend.
- Implies buyers tried to push the price higher but sellers reclaimed control.
2. Bearish Engulfing
- The second bearish candle fully engulfs the first bullish candle.
- Indicates sellers may dominate coming price action.
3. Evening Star
- A mirror image of the Morning Star.
- Signals weakening buying pressure toward the end of a rally.
How Candlestick Patterns Work in Practice
Now that you know common patterns, let’s address how they work in real trading scenarios:
1. They Visualize Price Action
Candlestick patterns work by converting raw price data into a visual format that tells a story about buying and selling pressure. This visual clarity allows traders to quickly interpret trends and shifts.
2. They Represent Probability, Not Certainty
Patterns signal probabilities of continuation or reversal but are not guaranteed predictions. Experienced traders often wait for confirmation signals from subsequent price action or technical indicators like RSI, moving averages, or volume.
3. They Work Across Timeframes
Whether you’re trading intraday, swing, or long-term positions, candlestick patterns work on any timeframe. Larger timeframes tend to provide more reliable patterns.
4. They Complement Other Technical Tools
Using patterns alongside support and resistance levels, trendlines, or oscillators improves signal accuracy and reduces false signals.
Advantages and Limitations
Advantages
- Condense complex data into clear visuals.
- Reflect market psychology in real time.
- Work across asset classes: stocks, forex, crypto, commodities.
Limitations
- Interpretation can be subjective.
- Patterns can fail — especially in highly volatile or low-volume markets.
- Shouldn’t be used in isolation.
Conclusion
Candlestick patterns work in the sense that they provide valuable insights into market behavior and trader psychology. They transform historical price data into visual patterns that help traders assess the likelihood of trend continuations or reversals.
However, candlestick patterns are not a crystal ball. They are probabilistic tools that become much more powerful when used with trend analysis, confirmations, and risk management strategies.
Whether you’re a beginner learning how markets move or an experienced trader refining your strategy, mastering candlestick patterns is essential for reading price action with confidence and precision.
Source: This article references publicly available materials including “5 Most Powerful Candlestick Patterns” published on investopedia.com, “What Is a Candlestick?” published on heygotrade.com, “Candlestick Patterns: A Complete Guide” published on bajajamc.com, and “What Is a Candlestick Pattern?” published on mstock.com.
Disclaimer:
This article is for informational purposes only and should not be considered as financial or investment advice. The views and data presented are based on publicly available information and are subject to change without notice. Investing in financial markets involves risk, including the possible loss of capital. Past performance is not indicative of future results. Readers should do their own research or consult a qualified financial advisor before making any investment decisions. The author and publisher are not responsible for any losses arising from the use of this information. T&Cs apply. For full terms and conditions, please visit centrinocapital.com